

A Tale of Three (Iron) Vizzes
Three Years, Three Entries, and One Big Lesson from Iron Viz

Every year, Tableau hosts a data visualization competition called Iron Viz. In the qualifier round, participants have about a month to create a project using Tableau, judged on design, analysis, and storytelling. The top three entries advance to a live showdown at Tableau Conference—and compete for a cash prize and lifetime bragging rights.
The tagline of the competition is: “Win or learn. You can’t lose.”
It’s cheesy. At times, I’ve disagreed with it. But ultimately? I think it’s pretty true.
Here’s my journey.
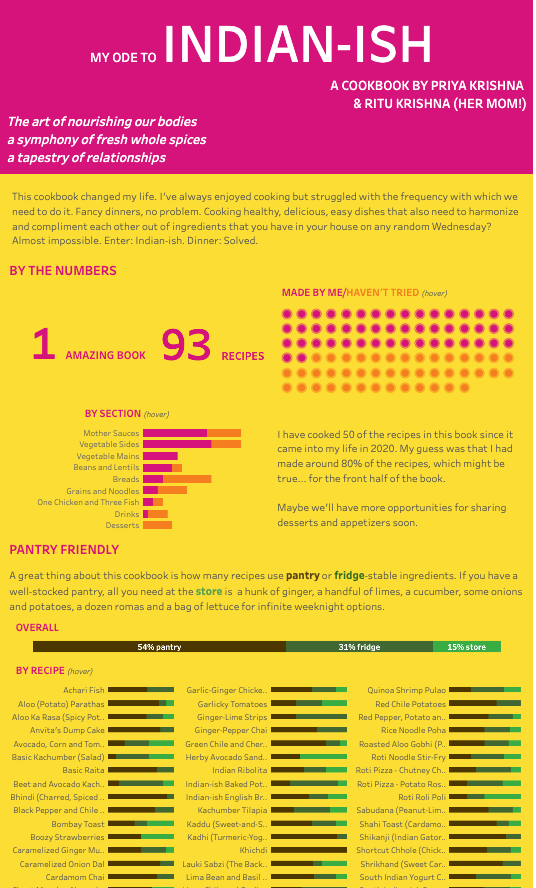
In 2022, I submitted a viz on the culinary arts that didn’t make it past the eligibility screen.
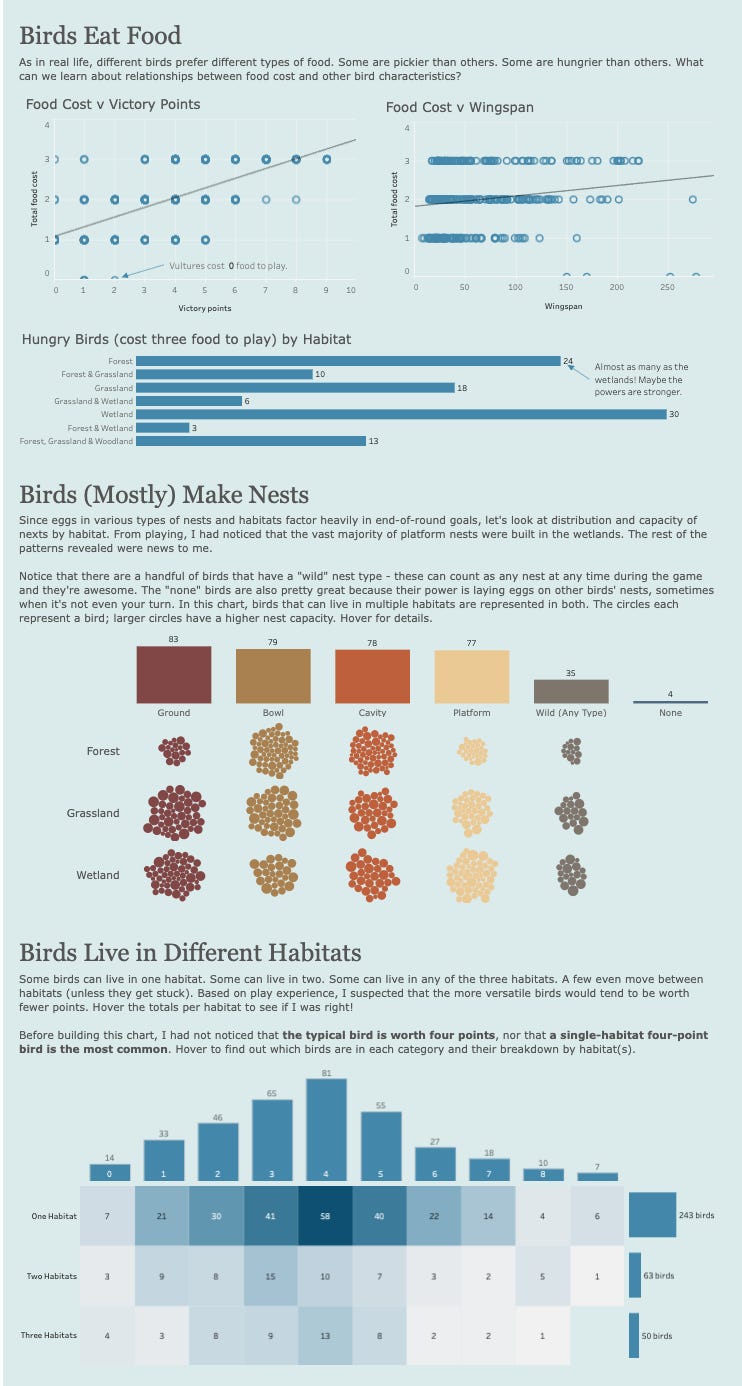
In 2024, I explored strategy in the board game Wingspan and earned solid marks.
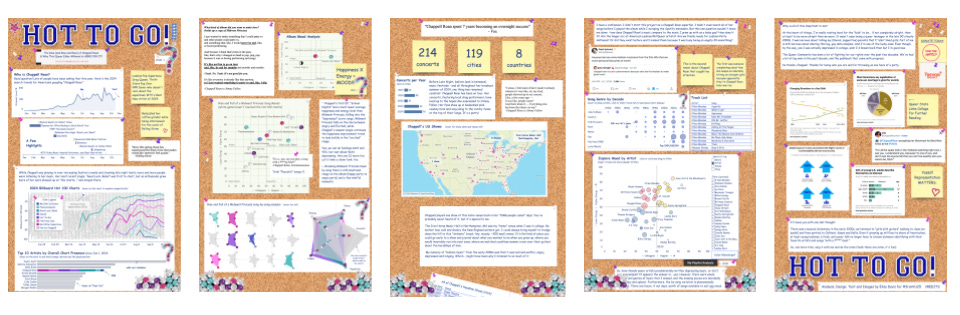
And in 2025, I went all-in on pop music and mood tracking with Chappell Roan (Hot to Go)—and received my highest score yet.
Across three years and three entries, I’ve learned a lot about Tableau—yes. But I’ve learned even more about storytelling, framing, and what makes a data visualization resonate.
Detailed category scores aren’t made public (even for finalists), but I’m sharing mine here—along with the full judge commentary.
Today’s post is a behind-the-scenes look at the world’s biggest data viz competition.
Next week, I’ll share reflections on what I’ve learned from the feedback—and how it’s shaping my approach going forward.
CHAPPELL ROAN (HOT TO GO) 2025
The Feedback
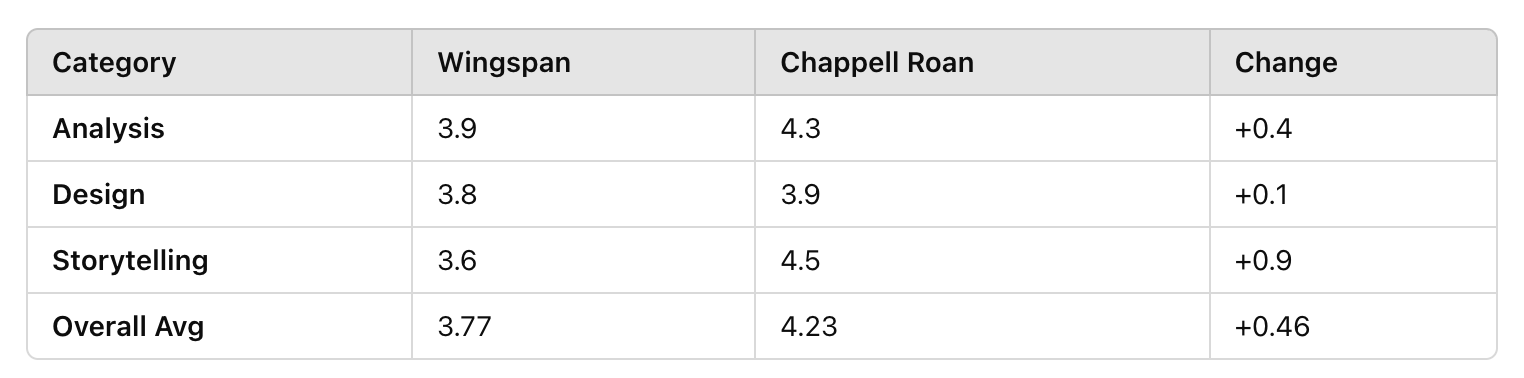
Here are your scores per category as well as some specific feedback from the community judges which was subjective. Note that the max score per category is 5.
Analysis: 4.3
The analysis is very good overall. There's some very solid work with the mood analysis some very good awareness of context and "what might have been missed?" throughout (especially in "The Context" and also the "Intro" and "So What"). Some of the analysis might have seemed a bit scattershot, in that it's a lot of different aspects of the single subject. However, the overall narrative being told brings it all together nicely (more on this in the design and storytelling).
Good analysis and clean data sets
Captivating analysis building a story as it goes. Incredibly engaging!
Design: 3.9
I loved the billboard design aesthetic! It brought together a lot of the different charts / analysis / instructions / quotes -- in a fun and interactive way that maintained interest throughout. The explanation of why the aesthetic was used was also a good addition. In and of itself the aesthetic was great, but it's great to have insight into why it was used as well.
Most of the charts hit the mark well. The Intro built from simple to complex and did a great job of giving some context for understanding the subject. The bump chart is very well done!
I would suggest making it a bit more clear that the top two charts are for 2024. It is in the sub-title, but not as prominently as it could have been and I missed it at first and was confused for a bit, not realizing that I was looking at only a single year (thinking the axes were mislabeled).
The Mood Analysis is well done and I liked the two charts to show Album and then individual songs. I would have liked to have been able to see the songs of other albums, but it didn't hurt to focus a single album. I personally struggle with radar charts, but these are some of the better examples I've seen --- especially with the small multiples for each song and then the layering. That worked far better than doing only one or the other.
The use of show/hide buttons is really well done -- especially the Headline Shows list on ""The Grind""!
The bulletin board theme adds to the design concept.
Overall, this is an incredibly effective and creative design! Lost some accessibility points due to the busy background and colour contrast, although these work within the context of the story. It would have been useful to include instructions re: interactivity, eg. Top 10 artists bar chart filters the 2024 Billboard Hot 100. It is not stated if the radar charts are in a particular order - Popularity is noted on the layered version, is this the order of the single versions? Love the pictures on the final view that link to further info, but the font is a little small.
Storytelling: 4.5
Overall, the flow of the story is well done and keeps interest throughout. The Intro gives a good understanding of the subject and each subsequent tab added detail. The billboard aesthetic and design gave an eclectic feel to the story, which worked well overall, but did sometimes make it hard to know where story was going. However, the "Context" and "So What" conclusion tied it up nicely in the end.
This viz built my interest in learning more about the artist.
Captivating visualisation! This grabbed my attention and held it throughout the viz journey. Exploration of song type popularity over time, mood by song/artist - and the ability to explore for myself was very powerful.
Overall feedback:
Overall, this is a very solid entry with some good analysis, very well-done design and a story that flowed with a great interplay between the facts & data along with the personal experience of the author! Keep up the good work!
I also love this pinboard format, and the viz author's personality shone through at every point of this viz. Excellent exploration, analysis and storytelling. Enjoyed marking this one a lot!
WINGSPAN (2024)
Thank you for participating in Iron Viz! Here are your scores per category as well as some specific feedback from the community judges. Note that the max score per category is 5 and feedback was not required from judges.
Analysis: 3.9
I like that you've analysed many different aspects of the game, and even shown the areas where your analysis taught you new things too.
There are some unused calculated fields that should have been hidden or removed from the viz. (I'm really intrigued by the region calcs and want to see what you had planned with them, but given the focus of the dashboard on game play, I'm kind of glad you didn't try to just show region for the sake of showing region.)
Design: 3.8
I like the design of your visualisation. The colours are consistent and feel appropriate to the categories shown. In the main, the graphs are well chosen however the food vs points/wingspan scatter graphs don't show multiple birds in one space very well. One of the lines on the line graph is also mislabelled or the wrong colour (the green and red lines are swapped around in the tooltip). Unfortunately the part of the visualisation where you can look at individual cards doesn't quite work as intended as a lot of the fields don't react when a new bird is selected from the dropdown filter.
Using different text sizes on headers to indicate visual hierarchy was a nice touch (though I have to admit that I didn't notice it until the very end).
Some text in charts and tooltips is too small to read. Also, the text in many of the tooltips is center-aligned, which can also make it harder to read.
I like how you used Tableau sheets (rather than background images) to construct elements of the game play, like the table of game pieces, the mat, and the bird card. In the background about the game, I would have liked to see a similar "score card" that summarized the game's rating, number of games sold, versions, etc., because that's a really big block of text. In the bird card, I would have liked to see the numbers pop a bit more, to see a bit more design behind it.
The nest chart--I'm not a fan of bubble charts, but you used them really well here!
Mixing the heatmaps and the bar charts was a good move on the habitats "chart." I like that you included a viz in tooltips with a few of these charts. However, with the bird names on the heatmap, some boxes had too many birds to see the embedded viz ("view is too large to show"); this should have been caught during testing.
I liked how you were purposeful with color throughout; you stuck with blue unless there was a reason not to, which was effective.
Storytelling: 3.6
Starting with context--its development, ratings, etc.--was a great move. (Also the show/hide container with the definitions? Genius!) It really set the stage for the story you're telling of how to play the game and why you're doing it in the first place--to beat your friend Dash!. I also liked seeing the interjections of what you learned in the analysis process--insight is part of the reason we analyze data! Including your own scores was another nice touch, though you talked about your scores trending higher in the text, but didn't include a trendline in the chart to reinforce that.
General feedback:
First off, nicely done! It is clear you put a ton of work into this viz, and your love of Wingspan oozes from the screen. A couple of small suggestions that I think would tighten this up:
I would have loved to get to the analysis quickly, and hide the How to Play section. It's extensive and necessary for anyone who hasn't played Wingspan, but I wanted to know what your data analysis had uncovered.
Because the game seems fairly complex (at least to me, having never played), I would have loved some additional guidance on the analysis. For example, you ask the question "Ravens are the best birds in the game. Analytically, can we figure out why?"...but even after spending a good amount of time with the viz, I still don't know why. There's a gap (and it could be my attention span!) between the presentation of the data and the analytical conclusion. As you say, "All this analysis, yet we've barely scratched the surface" -- a clearer set of conclusions would have elevated this from informational to analytically insightful.
Overall, nice work on this, and good luck beating Dash!
You should be proud of these numbers - getting above a 3 per category in IV qualifiers is a huge accomplishment and we hope you walked away more confident in your Tableau skills. Thank you again for participating and we hope to see you back next year!
Indian-ish (2022)
General Feedback
Your entry has been deemed ineligible due to being unrelated or too loosely related to the theme of Visualizing the Arts.
To get a bit more specific on our ineligibility decision, the theme of this years Iron Viz Qualifiers was 'Visualizing the Arts,' - we intentionally made it a broad topic so we could get entries from all over the art spectrum. While the theme may be broad, the vizzes entered should focus on the theme itself, ie. the arts/art. I do agree that the culinary arts are a very valid and important form of art, however, your entry was discussed by our entire internal Iron Viz core team before we made the ineligibility decision. The decision was made because your viz was not focused on the art of cooking itself, but instead specific ingredients, the frequency of use, where ingredients fit into different recipes as well as where they fit in the kitchen, etc. Art is mentioned once at the start of the viz, but the viz itself fits into the food category.
(Brief) Reflection
I’m including my 2022 entry here not to stir the pot or air old grievances. I was pretty upset at the time, but I now see that experience for what it was: a critical failure of storytelling.
In that first entry, I was trying to stand out by taking a creative angle on the theme. But at the same time, I was too shy to fully commit to writing a compelling narrative around the topic I’d chosen. I let the charts speak for me—and they told a story of craft, not art. That nuance mattered.
Ultimately, my disqualification is something nobody remembers or cares about.
(OK—maybe I still care. A little.)
But the work speaks for itself. It’s a striking piece, and I stand by the design and analysis even now. And I did walk away with something valuable: a reminder that if you’re entering a competition—even a creative one—you still have to follow the rules. Especially if you’re trying to push the boundaries.
Tune in next time for more reflections, lessons learned, and a spicy take:
Why I don’t actually think Iron Viz is a data visualization competition.
AI Disclosure: I wrote this all myself, then ChatGPT helped make “a lightly edited version that keeps your tone but improves flow and clarity.” You’re welcome.